
RBM Dashboard
Dashboard
The RCS Dashboard allows you to view all the analytics of your templates. You can select the date range according to your choice and view how your templates have performed. You can see the number of messages submitted, sent, read, read, delivered, failed and fallback SMS/WBS.
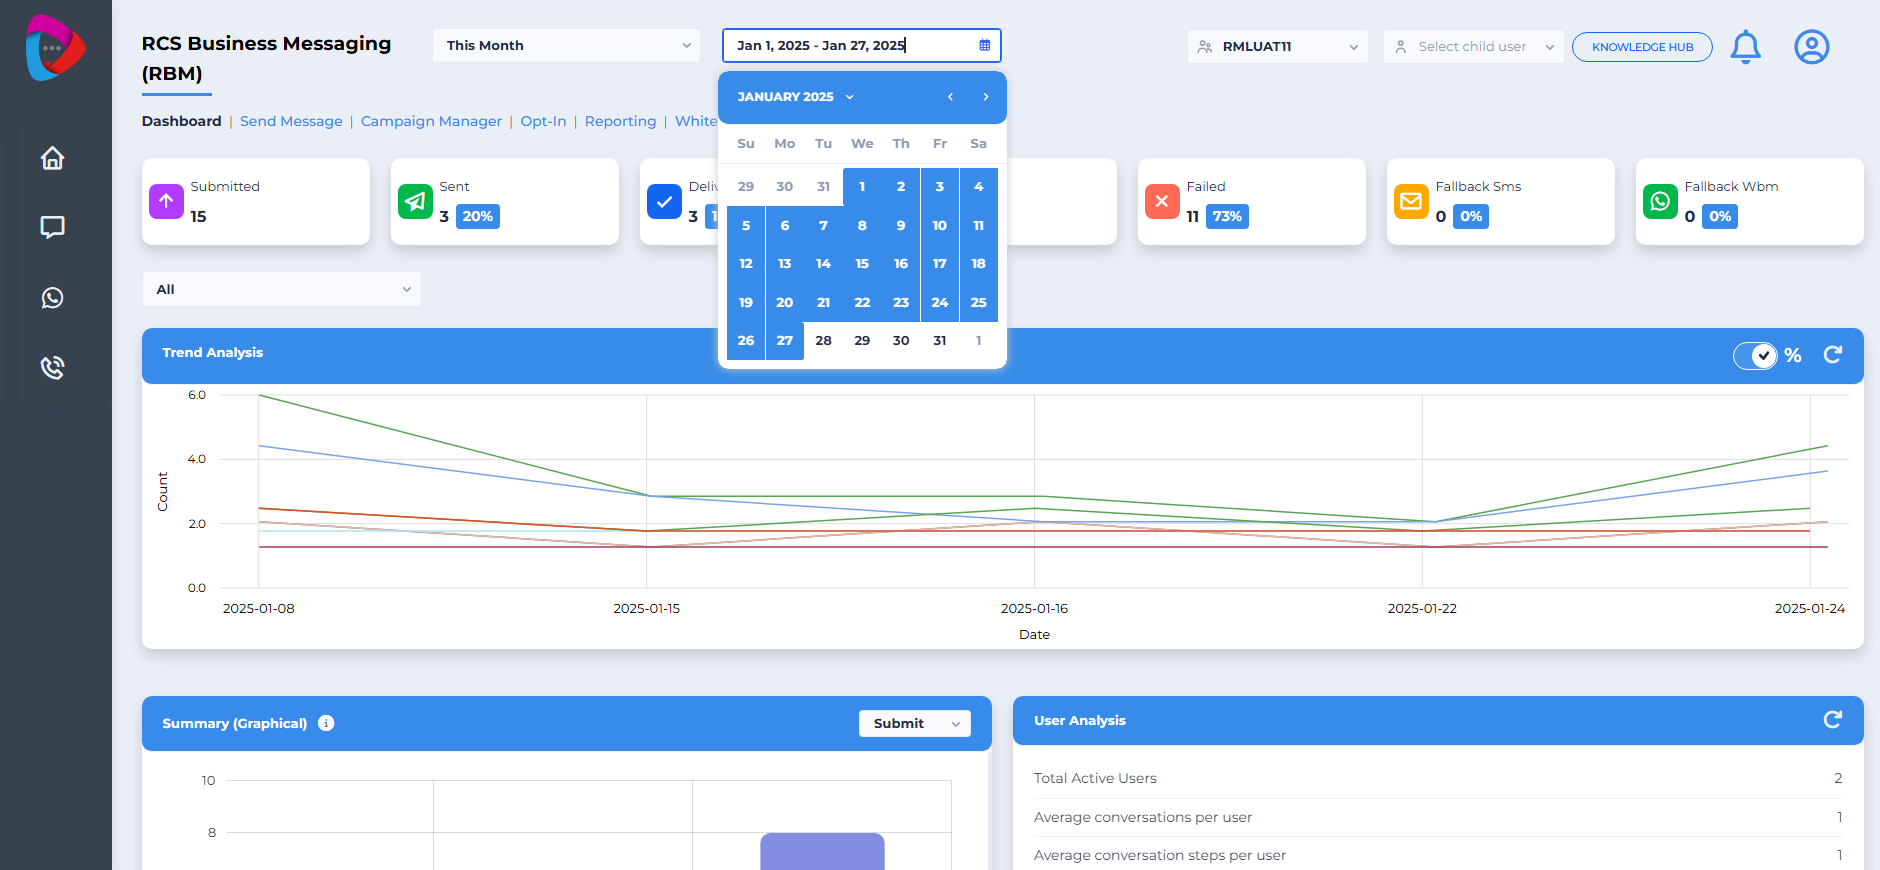
Dashboard
The dashboard also displays a Trend Analysis Graph which includes all the below details.
-
Trend Analysis : Where previous data & current data can be used to estimate user reach.
-
Summary : You can view a summary of the selected date range based on the indicated categories such as Submitted, Sent, and Delivered..
-
User Analysis : Here you may see the number of active users, the number of conversations per user, and so on.
-
Submitted Analysis : You can see how many numbers have been transmitted, how many are still pending, and how many have failed.
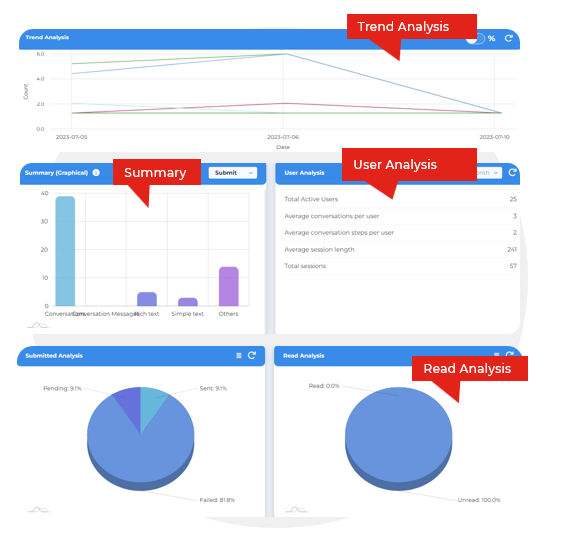
RBM Dashboard — (Trend & Latest campaign analysis)
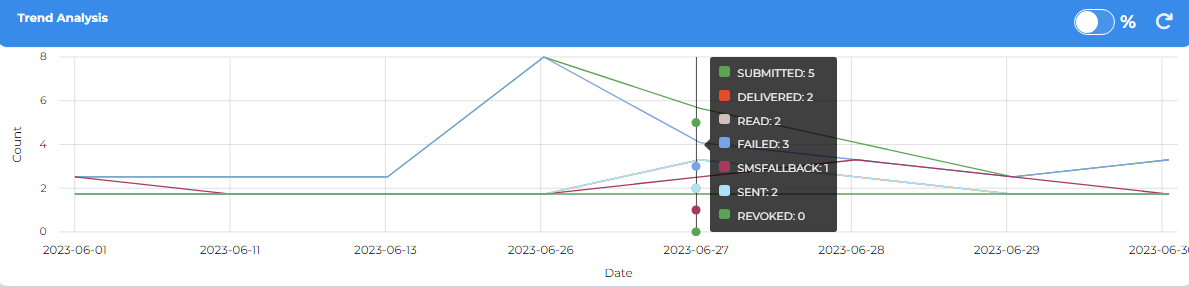
Trend Analysis
A graphical representation of total messages.
| Metric | Description |
|---|---|
| Submitted | Total messages submitted. |
| Sent | Total messages sent. |
| Delivered | Total messages delivered. |
| Failed | Total messages that failed. |
| Read | Total messages read by users. |
| Fallback | Total messages sent through fallback. |
RBM Dashboard — (Summary)
Summary (Count)
-
Total Submitted: Total no. of mobile numbers uploaded in a campaign using the agent or single number count
-
Total Sent (MT): Total no. of mobile numbers Accepted/Sent post capability check by the systems (RCS capable handset). In short, this is the total no. of messages sent on RCS enabled mobile devices.
-
Total messages delivered: Total no. of messages delivered to the RCS enabled mobile numbers. (Note: Some messages may be sent but not delivered due to factors like internet etc.)
-
Total messages read: Total no. of RBM messages read by users.
-
Total Failed: Total no. of messages that have failed to be delivered due to factors such as Non-RCS enabled devices, Data not available at the time of sending the RCS message etc.
-
Total fallback SMS: Total no. of messages that have been sent as a Fall back to SMS (in case of non delivery to RCS enabled devices. For this Fallback to SMS as a feature has to be enabled)
-
Total Received (MO): Total no. of responses/clicks received from the users from the CTA buttons in the messages
-
Total Actions (MO): Total no. of suggested actions performed by users (CTA/CTR)
-
Total Text (MO): Total no. of free text sent/typed by the end users
-
Total Others (MO): Total no. of Other Message Types sent
-
Total Response (MO): Total no. of responses including Suggested Replies(tapped by users), Suggested Replies (Rich Card/Carousel) and independent replies.
RBM Dashboard — (User analysis)
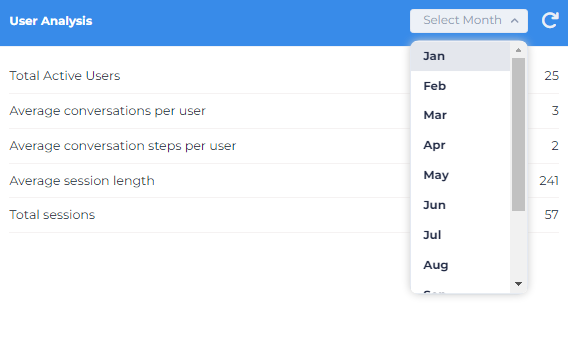
User Analysis (Count)
User analysis is majorly incase of conversational session or chatbot interaction with the brands agent
-
Total Active users: Total no. of Users whose sessions have been created at least once.
-
Average session length: An average of time between 2 MO messages (in seconds)
-
Total active users: Total no. of active users
-
Total new users: Total no. of new users. A new user is a unique user whose session has been created for the first time.
-
Average conversation steps per user: Total MO received
-
Average conversation per user: Total no. of sessions per user
-
Total sessions: Total no. of sessions (both Active & New Users)
Updated 21 days ago