
The Agent Dashboard
As you handle conversations day to day, the Agent Dashboard is where you come to see how it's all adding up. Think of it as your personal performance snapshot — a numbers-based view of your activity across any date range you choose.
Whether you're checking in before a team meeting, reviewing a busy week, or just keeping tabs on your own workload, this is your go-to screen.
What Is the Agent Dashboard?
The Agent Dashboard is your personal performance snapshot. It gives you a quick, numbers-based view of how your conversations are tracking — within any date range you choose.
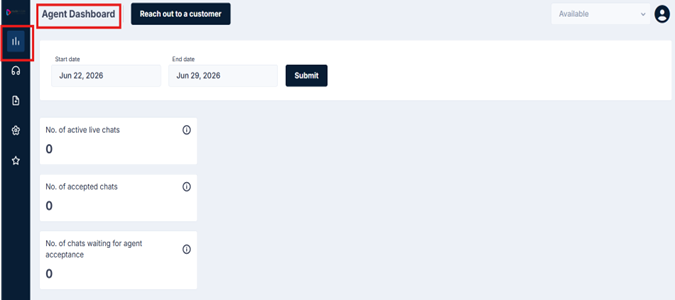
This is the screen to check when you want to understand your own activity, spot where things might be piling up, or simply stay on top of your workload at a glance.
Setting Your Date Range
At the top of the dashboard, you'll see two date fields — Start Date and End Date.
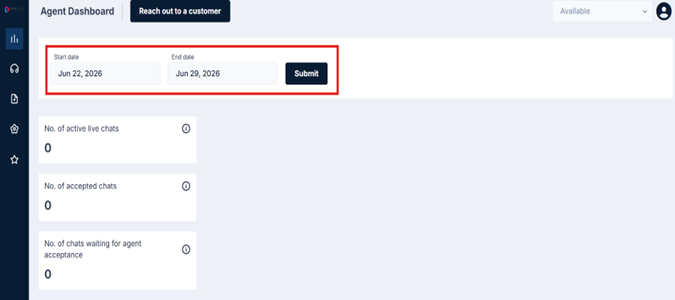
These let you control the time period you want to view data for. All the metrics on this screen will reflect only the conversations that fall within the dates you select.
How to use it:
- Click on the Start Date field and select your preferred start date
- Click on the End Date field and select your preferred end date
- Click Submit to load the data for that period
Tip: Use this to review your activity for a specific day, week, or month — useful before a team check-in or performance review.
Your Key Metrics
Once your date range is set, the dashboard displays a set of metric cards. Here's what each one tells you:
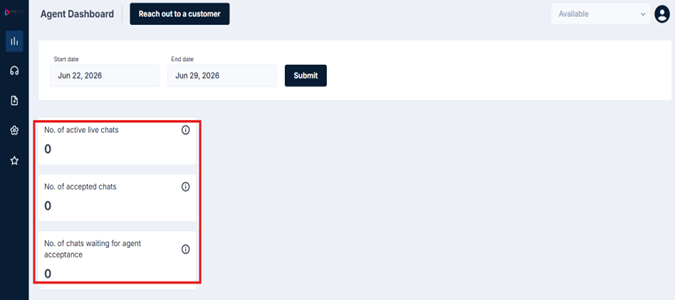
No. of Active Live Chats
The number of conversations that are currently live and ongoing at this moment — chats where you are actively engaged with a customer in real time.
📌 This is a live count. It reflects what's happening right now, not just within the selected date range.
No. of Accepted Chats
The total number of customer conversations you accepted and took ownership of within the selected date range.
This is a good indicator of your overall volume — how many customers you've engaged with during the period.
No. of Chats Waiting for Agent Acceptance
The number of incoming customer conversations that are sitting in the queue and have not yet been accepted by any agent.
If this number is high, it means customers are waiting. Check your Live Chat screen and accept pending conversations promptly.
Keep an eye on this one. A consistently high number here could mean the queue is building up faster than it's being handled — worth flagging to your supervisor if you notice a pattern.
Your Activity Charts
Below the metric cards, the dashboard displays a series of line graphs — one for each tracked activity. Each graph plots your numbers day by day across your selected date range, so you can see not just your totals but how your activity has been distributed over time.
Working Time
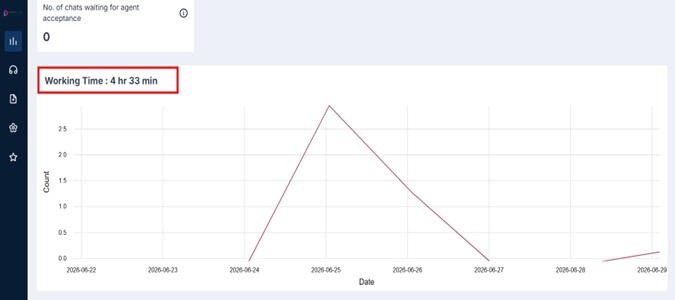
This shows the total time you were actively logged in and working within the selected date range — displayed both as a total figure at the top (for example, 4 hour 23 min) and as a day-by-day graph below.
Use this to get a sense of your active hours across the period. Spikes or dips on specific dates are easy to spot at a glance.
Reopen Conversations
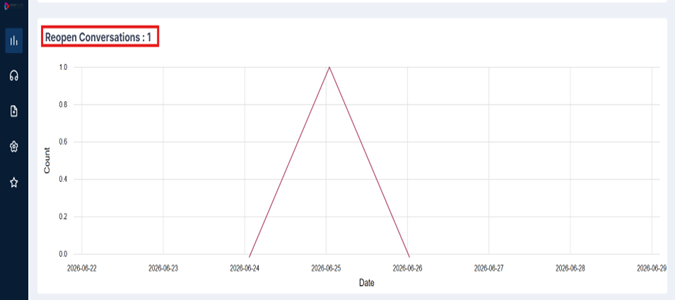
This shows the number of conversations that were reopened after being resolved within the selected date range — again displayed as a total count and plotted across dates.
A reopen typically means a customer came back with a follow-up after their chat was closed. Keeping this number low is a good indicator that issues are being fully resolved the first time.
Resolved Conversations
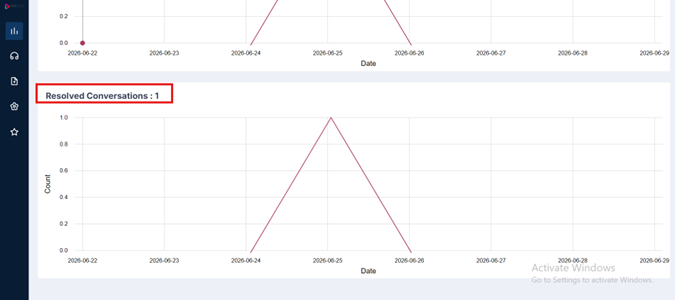
This shows the total number of conversations you successfully resolved within the selected date range, plotted day by day across the period.
This is one of your most important productivity indicators — it reflects how many customer issues you've fully closed out. A steady or growing line here is a good sign.
Updated 3 months ago